Mostrando entradas con la etiqueta Stats-Problems. Mostrar todas las entradas

jueves, 9 de junio de 2011

Problem21: VAD

¡Puedes leer este texto en español! Problema21: VAD

Ej21. The proportion of patients who are cured of a disease through a treatment is equal to 0.8. If 20 patients of this disease are undergoing the treatment, what probability will there be that 18 patients will be cured?.


We conduct a data compilation given by problem statement:

· X ≡ 'Number of patients who are cured of a disease through a treatment'.
· The random variable X follows a Binomial distribution: X ~ B(20, 0.8).

We have to get the following probability:

P(X = 18) = 20C18·0.818·(1-0.8)20-18 ≈ 0.136909

Finally, the probability of being cured 18 patients with this treatment is 0.136909.

miércoles, 8 de junio de 2011

Problem43: Probability

¡Puedes leer este texto en español! Problema43: Probabilidad

Ej43. An urn A has 5 white balls and 5 black ones. Another urn B, has 3 white balls and 3 black ones. An urn is chosen at random and two balls are drawn at the same time.

Calculate the probability that both balls will be black.


We conduct a data compilation given by problem statement:

· Urn with letter A: 5 white balls and 5 black ones. Total: 5+5 = 10.
· Urn with letter B: 3 white balls and 3 black ones. Total: 3+3 = 6.

· N ≡ 'Both balls drawn are black'.
· A ≡ 'Ball drawn of the urn A'.
· B ≡ 'Ball drawn of the urn B'.

· P(A) = P(B) = 1/2.

The solution to this problem is as follows:


Finally, the probability of getting two consecutive black balls and without replacement is approximately, 0.211111.

martes, 7 de junio de 2011

Problem19: VAD

¡Puedes leer este texto en español! Problema19: VAD

Ej19. The number of surface defects of the plastic panels used inside the car, follows a Poisson distribution with value mean equal to 0.5 defects per square meter of panel.

If the inside the car has 4 square meter of this material then, which is the probability that there won't be any surface defects?
.


We conduct a data compilation given by problem statement:

· X ≡ 'Number of surface defects of the plastic panels that are used inside the car'.
· The random variable X follows a Poisson distribution: X ~ P(0.5).

If a car has 4 m2 of this material, we have to adapt the variable for this specification:

· Random variable X with 4 m2: X ~ P(4·0.5) = P(2).

We must get the following probability:


Finally, the probability that there won't be any surface defect of the plastic panels inside the car with 4 m2 of this material is 0.135335.

domingo, 5 de junio de 2011

Problem88: VAD

¡Puedes leer este texto en español! Problema88: VAD

Ej88. A company works to the production and sale of children's puzzle of 50 pieces each one. The probability that the puzzle has a print defect is 0.01 and a cut defect is 0.05.

It's possible that there are both defects independently at each piece. Calculate the average number of defectives pieces that exist at a children's puzzle.


We perform a data compilation given by problem statement:

· I ≡ 'A print defect'.
· C ≡ 'A cut defect'.

· P(I) = 0.01
· P(C) = 0.05

· D ≡ 'The piece is defect'.

· P(D) = P(I ∪ C) = P(I) + P(C) - P(I ∩ C) = 0.01 + 0.05 - 0.01·0.05 = 0.0595

· X ≡ 'Number of defectives pieces' X ~ B(50, 0.0595).

The random variable X follows a Binomial Distribution, so we apply the mean of this distribution:

· μ = n·p = 50·0.0595 = 2.975

Finally, the average number of defectives pieces is 2.975.

viernes, 3 de junio de 2011

Problem14: Probability

¡Puedes leer este texto en español! Problema14: Probabilidad

Ej14. For some dice, the probability of being a face, when pulled, is proportional to the number of points that it showed. Calculate the probability of getting with this dice, an even number.


The sample space of the dice is:


Ω = {1, 2, 3, 4, 5, 6}


The probability of getting any value of the dice is proportional to its value.


So, we have to get all values that there in a dice:


Total points = 1+2+3+4+5+6 = 21


To get an element, its probability will be its value among the total points of the dice, in other words:


P(1) = 1/21, P(2) = 2/21, P(3) = 3/21, P(4) = 4/21, P(5) = 5/21, P(6) = 6/21


It creates the following event:


A ΞIt's an even number


The event A has the following elements:


A = {2, 4, 6}


And finally, the probability of event A, is the sum of the probabilities of all its components:


P(A)= P(2) + P(4) + P(6) = 2/21 + 4/21 + 6/21 = 12/21 = 4/7


martes, 31 de mayo de 2011

Problem87: Probability

¡Puedes leer este texto en español! Problema87: Probabilidad

Ej87. A company makes a quality control to each batch of 16 engines. In the quality control, 2 engines are randomly selected (without replacement) of each batch of 16 engines and they are inspected.

If any of the two is defective, all the batch will be rejected but if none is defective, the 16 engines will be accepted and they will send for sell.

If it is inspected a batch of 16 engines which only has one defective, calculate the probability that the batch is rejected .


We perform a data compilation given by the problem statement

· It will randomly select two engines (without replacement) from a total of 16.
· It assumes that the engines are independent: P(Xn ∩ Xm) = 0
· Xi ≡ 'Defective i-Engine'.

· P(Xi) = 1/16.

We have to get the following probability:

P(X1 ∪ X2) = P(X1) + P(X2) = 1/16 + 1/16 = 1/8

So, the probability that the batch will be rejected (any of the engines is defective) is 0.125.

sábado, 28 de mayo de 2011

Problem81: Confidence Interval

¡Puedes leer este texto en español! Problema81: EYPH

Ej81. The personnel department of some company, wants to apply a discount to the insurance of those employees whose spending is less than 150 € as long as this porcion is not very high.

For this purpose, it took a sample of 100 employees of whom, 20 employees had spending less than 150 €.

Estimate a 95% confidence interval for proportion of employees with spending less than 150 €.


We perform a data collection given by problem statement:

· X ≡ 'Proportion of employees with spending less than 150€'.
· P(X) = 20/100 = 1/5.

We have to make a confidence interval of proportion but before we must check the following conditions:

· n = 100 ≥ 30 OK.
· n·p = 100·1/5 = 20 ≥ 5 OK.
· n·q = 100·(1-1/5) = 80 ≥ 5 OK.

It obtains the α-parameter: 100(1 - α) = 95, We solve: α = 0.05.

· z0.05/2 = z0.025

We have to consider conditions of the Normal table, so we have to adapt the value:

0.5 - 0.025 = 0.475

Looking in the Normal table, we obtain the following value: 1.96.

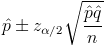
The confidence interval of proportion has the following mathematical expression:


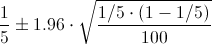
Now, we have all necessary data to make a 95% confidence interval of proportion of employees whose spending is less than 150€, we just replace values:


Finally, the problem solution is:

[0.1216, 0.2784]

viernes, 27 de mayo de 2011

Problem90: VAD

¡Puedes leer este texto en español! Problema90: VAD

Ej90. An Internet user gets an average of 9 emails per hour to his personal account. This user also has a second account for professional use which gets an average of 36 daily emails.

From previous studies it is known that the probability of getting SPAM is aproximately 0.571429 on both accounts.

The user has noticed that emails appear of homogeneous form all along hour of the day.

Calculate the probability of getting more than 10 SPAM in an hour between both accounts
.


We perform a data compilation given by the problem:

· A ≡ 'Number of emails received to personal account'.
· B ≡ 'Number of emails received to professional account'.

Emails received per hour on both events (we have considered that a day has 24 hours):

· A = 9 emails/hour.
· B = 36/24 = 1.5 emails/hour.

So, the average total number of emails on both accounts are: 9 + 1.5 = 10.5 emails/hour.

· S ≡ 'The email is SPAM'.

· P(S) = 0.571429

· C ≡ 'Number of SPAM emails on either of both accounts'.

We know two things: the average number of emails received on both accounts and the probability of being SPAM. So, we can create the next event:

C = λ = 10.5·0.571429 = 6.000005

So, the C event follows a Poisson distribution: C ~ P(6.000005) SPAM/hour.

We must obtain the following probability:

P(C > 10) = 1 - P(C ≤ 10) = 1 - [P(C = 0) + ··· + P(C = 10)]

There are many elements to sort out, then we're going to use the R software for that purpose:

> ppois(c(10), 6.000005, lower.tail = F)
[1] 0.04262113


Finally, the probability getting more than 10 SPAM emails in an hour on either both accounts, is aproximately 0.042621.

viernes, 20 de mayo de 2011

Problem82: Hypothesis Test

¡Puedes leer este texto en español! Problema82: Puebas de Hipótesis

Ej82. A soft drink company says that its soft drink cans contain 33 cl. To know if it's true, 50 cans are selected randomly. The sample mean was 32 cl and the sample standard deviation was 2 cl.

If the studio follows a Normal distribution, Can we say that they are lying to consumers at the 95% confidence level?


We perform a data compilation given by problem statement:

· Sample size: n = 50.
· Sample mean: x = 32.
· Sample standard deviation: Sc = 2.
· X ≡ 'Content of soft drink cans in cl'.
· The random variate X follows a Normal distribution: X ~ N(32, 2)

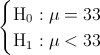
The Hypothesis Test given by the problem statement is:


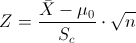
It's a Hypothesis Test to test the mean with unknown standard variation and the sample size is greater than 30, the statistical is:


We obtain the statistical value:


To check if we accept or reject the Null Hypothesis, we'll use the method of critical region:

Z ≤ - zα

We get the α-parameter: 100(1 - α) = 95, we solve: α = 0.05.

· zα = z0.05

Considering the characteristics of Aqueronte's tables, we must adapt that value:

0.5 - 0.05 = 0.45

In this case, it isn't the exact value so, we make a linear interpolation:

..1.64.............Z..........1.65
0.4495........0.45.....0.4505

Where:

1.64 - 1.65.--> 0.4495 - 0.4505
1.64 - Z..--> 0.4495 - 0.45

We calculate:


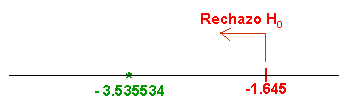
We check the statistical value with the critical region:


The statistical value, -3.535534 is less than the critical region value, -1.645, so we reject the Null Hypothesis and we accept the Alternative Hypothesis.

This means, there are enough evidences that the content of soft drink cans is less than 33 cl, in other words, the soft drink company is lying to consumers.


Now, let's get the p-value of test to corroborate the previous study. In our case, there is a one-tailed test then, the p-value is calculated as:

p-value = P(Z >|z|) = P(Z > |-3.535534|) ≈ 1 - P(Z ≤ 3.54) = 1 - [0.5 + Φ(3.54)]

We calculate and we search the value in Normal table:

p-value = 0.5 - Φ(3.54) = 0.5 - 0.4998 = 0.0002

As the level of significance, α = 0.05, is greater than the p-value then, we reject the Null Hypothesis and we accept the Alternative Hypothesis.

So, it's demonstrated that the soft drink company is lying to consumers by both methods.

jueves, 19 de mayo de 2011

Problem92: Probability

España¡Puedes leer este texto en español! Problema92: Probabilidad

Ej92. A teacher with too many years of experience has seen that the 60% of students who don't pass a determinated exam going to review the exam while the students with passing grades going to review the exam a 5% and finally, the students with notable (or more) grades are a 10% who going to review the exam.

In the exam whose has review just finished, there were a 40% of suspended, a 50% of passing grades and lastly a 10% of notable (or more) grades.

Calculate the probability that an exam which has been reviewed, this was qualified as suspended.


We perform a data compilation given by the problem statement:

· S ≡ 'Students who have suspended the exam'.
· A ≡ 'Students who have passing grades'.
· X ≡ 'Students who have notable (or more) grades'.

· P(S) = 0.4.
· P(A) = 0.5.
· P(X) = 0.1.

· R ≡ 'Students who going to review the exam'.

· P(R|S) = 0.6.
· P(R|A) = 0.05.
· P(R|X) = 0.1.

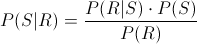
We are asked to obtain that an exam which has been reviewed, it was qualified as suspended, we need to apply the Bayes's Theorem for this purpose:


But before, we must obtain the probability of R event (Students who going to review the exam), therefore, we use the Total Probability law:

P(R) = P(R|S)·P(S) + P(R|A)·P(A) + P(R|X)·P(X)

We replace for the numerical values to get the probability of that event:

P(R) = P(R|S)·P(S) + P(R|A)·P(A) + P(R|X)·P(X) = 0.6·0.4 + 0.05·0.5 + 0.1·0.1 = 0.275

At present, we can provide the solution to this problem:


So, the probability that an exam which has been reviewed, this was qualified as suspended is, aproximately 0.872727.